
This technical paper presents a prediction approach for cooling water heat exchanger healthiness or cleanliness that aims to facilitate proactive maintenance in industrial operations. Traditional maintenance approaches which rely on time-based measures, resulting in unwarranted repairs and cost.
Koay Tze How, Nor Naqiah M Nazari Anuar, Lim Beng Lin, Sy M Hafiz B Al-Idrus, PETRONAS
To address the outlined issue, a prediction model for cooling water heat exchangers is proposed, leveraging machine learning algorithms to analyse 1-year historical data and predict the health condition of the heat exchangers. The model utilizes diverse parameters, which are heat transfer coefficient, heat transfer area, maximum skin temperature and temperature inlet hot fluid. These data are collected from the heat exchanger in the specific business unit and used to develop a prediction model.
The results showcase a promising method for forecasting the heat exchangers health status, offering valuable insights for proactive maintenance, and preventing unforeseen failures. This paper discusses on the methodology used for developing the prediction model, the utilization of the confirmation model based on inspection reports, and the subsequent implementation of the model.
This study serves as a foundation for future research and development efforts towards the implementation of an advanced and robust heat exchanger healthiness prediction model for the industry.
Introduction
In petrochemical plants, various equipment like heat exchangers operate simultaneously, continuous monitoring is crucial to prevent unplanned shutdowns that could cost millions in revenue losses. Digital twins for cooling water (CW) heat exchangers are being implemented, utilizing simulation and revalidation studies to monitor operating conditions. This helps the plant to manage maintenance and replacement effectively.
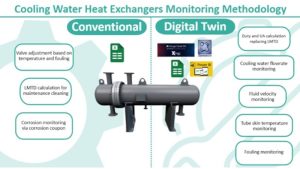
Digital twin heat exchanger healthiness monitoring
Oil and gas industry lacks digital twin platform for heat exchangers without hard sensors. Current monitoring methods are limited and often inaccurate, relying on manual calculations.
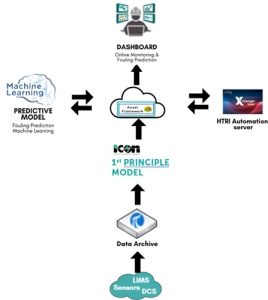
A new digital twin is needed. It is developed with integration of ICON Symmetry (ICON) for process simulation, Heat Transfer Research, Inc (HTRI) for thermal analysis, and Microsoft Azure Machine Learning (Azure) for fouling prediction. ICON simulates the cooling water network, HTRI uses ICON process parameters to calculate heat exchanger thermal performance, and Azure model predicts fouling based on HTRI output results such as skin temperature, fluid temperature, velocity, etc. All data feeds into a dashboard for real-time heat exchanger healthiness monitoring.
HTRI automation
The Digital Twin leverages HTRI automation as its core engine. It efficiently processes extensive equipment operational data simulated from ICON. This automation enables real-time analysis and instantaneous results generation, facilitating continuous equipment health monitoring and fouling prediction capabilities.
This automated approach represents a substantial improvement in operational efficiency, eliminating the impracticality of manual data entry for large datasets while ensuring consistent and reliable analysis outcomes.
Fouling prediction

There is no accurate method to perform heat exchanger fouling prediction without internal inspection. Historically, all CW heat exchanger were cleaned during every 3-year interval turnaround, irrespective of their conditions. This could result in unnecessary expenditure, encompassing both cleaning costs and inefficient use of manpower. To address these challenges, the team is developing a predictive model to gauge the fouling severity of individual heat exchangers. This model aims to extend the service life of equipment by accurately determining the optimal cleaning schedule, thereby reducing costs and improving operational efficiency.
Fouling is not built overnight
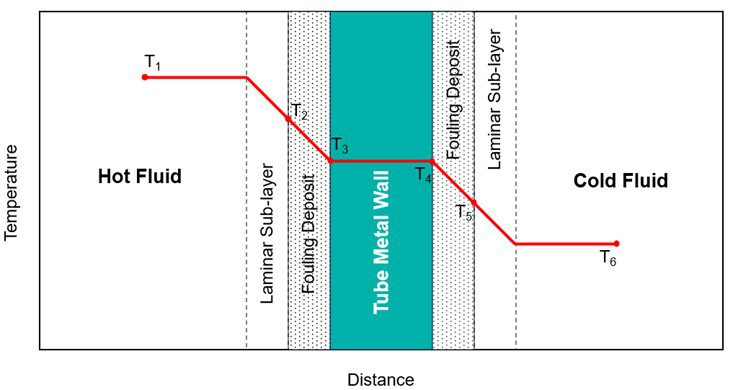
Fouling in heat exchangers significantly impacts equipment efficiency through the accumulation of unwanted materials (scale, biofilm, or particulates) on heat transfer surfaces. This accumulation creates thermal resistance, reducing heat transfer effectiveness and increasing operational costs.
Two critical parameters are primarily impacted by fouling:
- Fluid temperature – fouling deposits increase thermal resistance, creating additional barriers to heat transfer between fluids.
- Fluid velocity – deposit accumulation restricts flow channels, leading to increased fluid velocities and pressure drops.
Over time, the heat exchanger performance drops until the point which cleaning is necessary. The cleaning frequency varies among heat exchangers based on process conditions and equipment geometry.
Heat exchangers operating in cleaner conditions typically require less frequent maintenance compared to those in high-fouling environments.
Methodology
Data collection
The prediction of heat exchanger fouling requires identification of key operational parameters from both process and mechanical design aspects. Data acquisition of process parameters includes fluid properties, temperature and pressure profiles from limited number of sensors available at site.
The collected data is systematically organized in Excel, enabling comprehensive simulation of cooling water network operating conditions by ICON. This simulated process parameters will be delivered to HTRI for heat exchangers thermal analysis.
Additional equipment data, including engineering drawings and datasheets, are acquired for HTRI modelling purposes.
HTRI automation input
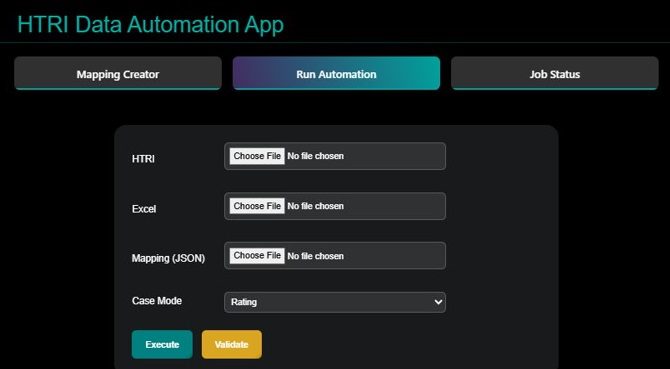
The in-house HTRI automation server operates through a streamlined three-component input system.
- HTRI model files – validated heat exchanger models
- PI Excel files – process parameters extracted from ICON
- JSON configuration files – structured mapping files for process parameters into HTRI
The system incorporates robust error handling protocols. When computational anomalies are detected, the program automatically suspends execution and generates error messages for user resolution. Upon successful completion of calculations, the automation server generates comprehensive output data in Excel, which is archived within the server for future reference
and analysis. Key operational parameters analysed include thermal duty, fluid composition, fluid temperature and pressure profiles, flowrate, etc.
HTRI automation output processing
The processing of HTRI output data follows a rigorous methodology to ensure data quality and reliability, the data was randomly selected for validation by engineers. Initial data preparation involves data cleaning to resolve missing values and duplicates. Comprehensive quality assessment using box plots in Azure, enabling the identification of outliers and understanding data distribution patterns.
Fouling prediction model development and validation strategy
The model development phase employs a structured approach to ensure optimal predictive capabilities. It is crucial to examine the relationships between fouling and operating variables through correlation analysis. Heat transfer coefficient (UA) exhibits linear relationships with fouling, thus Pearson correlation analysis is applied to identify influential operating variables as heat transfer coefficient or fouling predictors. Then, selection of regression models below is utilized for UA or fouling prediction.
- Linear Regression – baseline performance assessment
- Decision Tree – captures non-linear relationships
- Boosted Decision Tree – algorithms for enhanced prediction accuracy
These models were assessed using metrics such as Mean Absolute Error (MAE), Mean Squared Error (MSE), or Root Mean Squared Error (RMSE).
Hyperparameter tuning was performed to optimize the model’s performance by exploring different combinations of settings in Azure.
Once the model predicts the UA of the heat exchanger, this value will be graphed to determine cleaning period. Results will be validated with the equipment inspection report to confirm the accuracy.
Digital twin dashboard integration
Power BI Dashboard is developed to showcase heat exchanger operating parameters and fouling prediction monitoring. The deployment strategy in future will focuses on sustainable and scalable manner.
Results and discussion
HTRI automation system
HTRI automation successfully processes one year of simulated PI data to perform comprehensive thermal calculations for CW heat exchangers. HTRI output results are systematically organized for each variable such as tube skin temperature, fluid flowrate, temperature and velocity profiles, duty, etc. This ensures smooth data delivered to Azure for fouling prediction analysis.
This in-house solution has delivered significant direct cost savings without subscribing to external third-party technology, while achieving similar results and performance. Manual data entry duration and human error is reduced to the minimum.
This demonstrates comparable performance can be achieved while operating at limited time and resources, showcasing the efficiency of the automated approach.
| No | Independent Variables | Pearson Correlation Score |
| 1 | Tube Max Skin Temperature (K) | 0.65 |
| 2 | Heat Transfer Area (m2) | 0.524 |
| 3 | Temperature Inlet Cold Fluid (°C) | 0.489 |
| 4 | Temperature inlet Hot Fluid (°C) | 0.446 |
| 5 | Cooling Water Flowrate (m3/hr) | 0.4053 |
| 6 | Tube Maximum Velocity (m/s) | 0.4044 |
| 7 | Tube Minimum Velocity (m/s) | 0.4043 |
| 8 | Temperature Outlet Hot Fluid (°C) | 0.383 |
| 9 | Duty (kW) | 0.311 |
| 10 | Flowaret (kg/h) | 0.3034 |
Table 1. Pearson Correlation Scores
Fouling prediction – Variables selection by Pearson correlation test
This analysis helps identify which variables are dominantly correlated with heat transfer coefficient (UA) or fouling in the case, providing insights into which factors are likely significant predictors in the regression model. Top five variables with the highest absolute correlation coefficients will be focused for accurate fouling prediction.
According to the table above, the top five influential variables are:
- Tube max skin temperature(K)
- Heat transfer area (m2)
- Temperature inlet cold fluid (°C)
- Cooling water flowrate (m3/hr)
- Tube maximum velocity (m/s)
Fouling prediction – Regression model selection
Multiple regression models showcase in Table 2, were trained and tested on the same data. This analysis aims to achieve the second objective of building and evaluating several regression models to identify the best performer.
The results indicated that the linear regression model had the highest R2 and the lowest MAPE.
The R2 value shows how well the model’s predictions align with the actual data, with a higher R2 indicating a better fit. MAPE measures prediction accuracy as a percentage, with a lower MAPE suggesting fewer errors. Therefore, the linear regression model demonstrated the highest accuracy and reliability, a preferred choice for predicting UA.
The strong performance of the linear regression model can be attributed to its simplicity and the nature of the data. The relationships between the variables in the dataset are primarily linear, which is well-suited to the linear regression model. Additionally, its straightforward approach helps prevent overfitting, a common issue with more complex models such as decision trees and boosted decision trees.
| No | Model | Coefficient of Determination (R2) | Mean Absolute Percentage Error (MAPE) |
| 1 | Linear Regression | 0.65 | 0.61 |
| 2 | Boosted Tree Regression | -2.93 | 2.61 |
| 3 | Decision Tree Regression | -2.05 | 1.59 |
Table 2. Regression Models Comparison.


Fouling prediction – Results validation
After selecting the best regression model, the next step is predicting when the heat exchanger requires cleaning. In figures 6 and 7, red line represents the minimum overall heat transfer coefficient (UA) necessary for both fouled and clean heat exchanger to deliver the specified heat transfer. When the UA reaches this threshold, it indicates that the heat exchanger requires cleaning.
The model predicts UA for the next three months, with the trendline shown by the dotted line. The intersection with the minimum UA line suggests cleaning around January 2022 for clean heat exchangers and February 2021 for fouled ones. Accuracy is confirmed by internal inspection reports.
Figure 8 depicts the condition of E-21-02 and E-26-02 during the turnaround in June 2021. This observation aligns with the model’s prediction, which recommended cleaning around January 2022 for clean heat exchangers and February 2021 for fouled heat exchangers.
The implementation of digital twins in cooling water heat exchangers demonstrates significant potential for operational efficiency. Key benefits include:
- Improved decision-making: Real-time data allows for planning cleaning period effectively.
- Predictive maintenance: Detection of potential fouling reduces unplanned downtimes and maintenance costs.


Conclusion
The implementation of digital twins in heat exchanger maintenance offers a compelling case for industry adoption. By leveraging real-time data and predictive capabilities, businesses can enhance performance and reliability while achieving substantial cost savings. However, several challenges must be addressed to achieve accurate fouling prediction results. These includes PI data accuracy and quality, HTRI design model, digital twin system integration, etc.
Future research should focus on refining predictive algorithms and leveraging artificial intelligence to uncover further optimization opportunities.
The team planned to continuously improve data accuracy, enhance user interface, and expand fouling prediction capabilities to other types of heat exchanger.
Team appreciation: Upenthiran Ganeson, M Syahir Mohamad Zaki
References:
- Tubular Exchanger Manufacturers Association (TEMA) (2023). TEMA standards for tubular heat exchangers (11th Edition).
- Experimental/Numerical Investigation and Prediction of fouling in Multiphase flow Heat Exchangers: A Review.
- Heat Transfer Research Inc. Software.
- Microsoft Azure Machine Leaning Software.
- IcON Symmetry Process Simulation Software.
About this Technical Story
This Technical Story was first published in Heat Exchanger World Magazine in July 2025. To read more Technical Stories and many other articles, subscribe to our print magazine.
Technical Stories are regularly shared with our Heat Exchanger World community. Join us and share your own Technical Story on Heat Exchanger World online and in print.