
What’s in the deposit?
In this series of articles we will look at how heat exchangers foul, how to understand the root causes of fouling, and how to mitigate the impact of fouling. The material presented is based entirely on the author’s experience and analysis of operating situations in the Oil & Gas industry. However, many theories and varied experiences exist across the industry and amongst researchers.
By Himanshu Joshi – Heat exchanger specialist
In Part 1 we saw that several precursor materials could be responsible for fouling, and flow and temperature conditions affect the rate of deposition and the conversion of precursors to the ultimate fouling deposit. To understand which fouling mechanism applies and what remedial actions can be taken, one critical bit of information is what’s in the deposit – is it dominated by inorganic material or organic, and what that material consists of, including a quantification of the elements/compounds in the deposit. In this article we will see how to accurately quantify the composition of a fouling deposit and in Part 3 how to relate it to the heat exchanger flow and temperature conditions to fully understand the fouling mechanism.
The analysis procedure summarized in this article was described in detail in the Reference. It consists of a step of preparing the sample for analysis and conducting tests in a certain sequence to get all the relevant information, but without excessive testing. It is important to note that merely knowing which chemical elements or compounds are present in the deposit is usually not sufficiently useful information. It is critical to quantify each element and determine which, if any, dominate the deposit; or whether several types of solids are present in meaningful quantities.
Step 1 – Sample preparation
To get an accurate analysis of the deposit, correct sample preparation is the most critical step. There are two aspects to preparing the sample: Removal of trapped fluid and homogenization of the solids. The specific steps mentioned below apply to deposits from petroleum oil and petrochemicals processing heat exchangers (or other equipment) but the concepts will apply to any process. All subsequent analyses should be done on the sample prepared as below.
Process fluid removal – Deposits contain the process fluid which could be trapped within the deposit or just coating the samples. The deposit could also be contaminated with flushing solutions, water from a steam-out etc. The trapped fluids or flushing solutions are not part of the foulant and need to be removed before the deposit is analyzed. Toluene, methylene chloride or equivalent solvents should be used to fully extract and wash away such residual feeds and wash solutions. For the purpose of determining the root cause and potential mitigation techniques, we just want to know what’s in the solid part of the deposit, so including the process fluid and other liquids in the analysis will indicate the wrong composition.
To remove the fluids, add one of the above-mentioned solvents to a sufficient quantity of the sample for the needed analyses. Typically, 5-10 grams of the prepped sample is sufficient for the first level of study. If the sample appears to contain significant levels of unwanted fluids, select a larger quantity such that 5-10 grams of solvent-washed foulant can be recovered. Soak the deposit at room temperature for several hours in a sealed container with approximately 10:1 amount of the solvent. Filter the mixture and wash with additional solvent at least three times or more until the final filtrate is colorless indicating that all the trapped fluid has been removed, discard the filtrate, and dry the remaining deposit in a vacuum oven at 100°C overnight.
Homogenization – Fouling deposits are not uniform so we must mix the sample thoroughly to get an average composition and not be misled by analyzing a portion of the deposit which might happen to be rich in just one component. Homogenize the dried material by first grinding and sieving the entire sample to at least -60 mesh particle size, then mixing well.
Step 2 – TGA (ThermoGravimetric analysis)
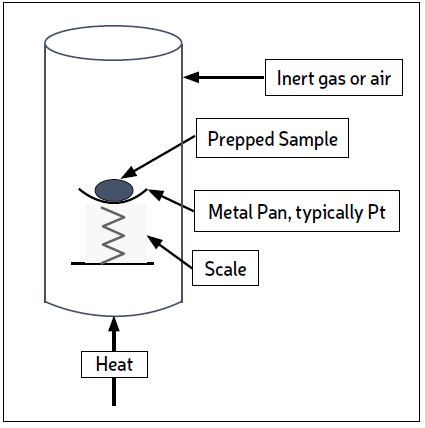
The recommended TGA test subjects the sample to heat under an inert atmosphere, increasing the temperature from ambient to 800 C, and continuously weighing the sample to measure weight loss. At 800 C air replaces the inert atmosphere so that the remaining sample can combust due to the presence of oxygen. At the end of combustion some solid will remain – it is called the ash. The test is shown conceptually in Fig. 1, but individual instruments available from suppliers will vary in detail. The test is quick (~3 hrs), inexpensive, and gives plenty of useful information. Most in-house analytical labs have a TGA instrument.
In most cases, the material lost in the heat-up to 800 C is organic material which is still volatile. When air is introduced the weight loss due to combustion indicates coke (or coke-like material, see Part 1). Ash is the inorganic portion of the deposit. TGA results give a good quantification of how much of the deposit is organic vs inorganic, and how much of the organic portion is coke.
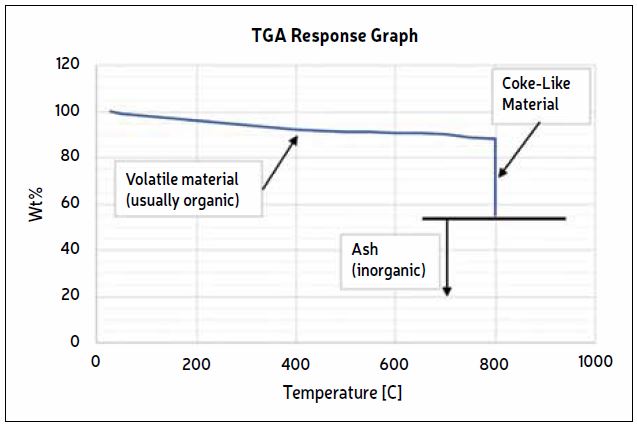
This helps guide further testing and eliminates unnecessary tests. A typical weight vs. time graph for a TGA is shown in Fig.2. The vertical axis shows the percentage of the starting weight going from 100% to the wt% ash. The chart can be interpreted as follows:
- Approximately 12% of the material is volatile organics (88 wt% remaining at 800 C), possibly polymeric material plus leftover fluids from incomplete sample preparation.
- Approximately 33% of the material is coke or coke-like (55% remaining after combustion, [88-55] = 33). This makes the total organic portion 45%.
- Approximately 55% of the material is ash which is the inorganic component of the deposit.
Step 3 – Elemental analysis
Elemental analysis involves three major tests – Carbon, Hydrogen, Nitrogen (CHN); Sulfur; and Metals and other inorgaincs. Which of these tests are necessary should be determined by the TGA results. For example, if the TGA shows 90% ash, the deposit is 90% inorganic and there is no need to quantify the carbon and hydrogen. On the other hand, a deposit could be 90% organic or a mixture, such as in Fig. 2. In the latter case all tests are required.
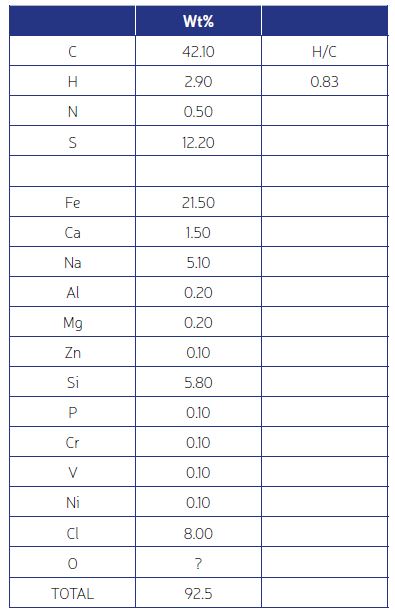
For all the above, standard tests (such as from the ASTM Standards) are available and are relatively low cost with a turnaround time of the order of a week. An example of results from analytical testing is shown in Fig. 3. It shows a roughly 45% organic component, amd inorganics which are mostly salt (NaCl), corrosion products (FeS), and silica (SiO2). In the next article (Part 3) we will see how to combine this information with process conditions to understand the fouling mechanism and ways to mitigate it.
Two important aspects of the information in Fig. 3 are: (1) Mass balance – the wt% of all detected elements should ideally add to 100%. In practice a value of 90% or greater is satisfactory. And many times, the deficit can be attributed to oxygen, such as here where the silicon must have oxygen associated with it. (2) The H/C atomic ratio. This value can be used to determine the temperature at which the coke-like material in the deposit was formed –more on this in Part 3.
Microscopy
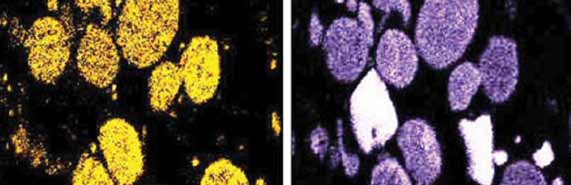
Microscopy is sometimes critical to understand the mechanism and identify the precursors. Additionally, it helps to confirm the analytical results. Two types of microscopies can be used: (1) SEM (Scanning Electron Microscopy) to understand the association of elements (Fig. 4) or to visually see how layers are formed on a surface, and (2) Cross-Polarized Light Optical microscopy to understand the nature of coke in the deposit. Details of both are in the Reference.
Second-level testing
If the two testing steps above (plus microscopy) leave some uncertainty, or you need to identify specific compounds, or the information is not sufficient to determine the whole composition, several second-level tests are possible. In the author’s experience, these tests are required <10% of the time.
- Carbon as Carbonate. This will help distinguish organic carbon from inorganic, and account for some of the unknown mass as oxygen.
- Sulfur Forms. Can be used to differentiate organic sulfur from inorganic (pyritic sulfur, sulfates).
- Neutron Activation Analysis – To measure oxygen accurately.
- X-Ray Diffraction. To identify specific crystalline compounds or phases of crystalline compounds (e.g., the form of iron sulfide).
Catch up on Fouling Focus!
Have you missed the earlier installments of this multi-part series? All articles are available in our online archive:
Part 1 – https://heat-exchanger-world.com/heat-exchanger-fouling-in-practice-understand-mitigate-1/
Part 3 – https://heat-exchanger-world.com/heat-exchanger-fouling-in-practice-understand-and-mitigate-part-3/
Part 4 – https://heat-exchanger-world.com/heat-exchanger-fouling-in-practice-understand-and-mitigate-part-4/
Part 5 – https://heat-exchanger-world.com/heat-exchanger-fouling-in-practice-understand-mitigate-part-5
References
[1] Joshi, H. m., in Crude Oil Fouling – Deposit Characterization, Measurements, and Modeling, Coletti, F., and Hewitt, g. F., Editors, pp 95-113, Elsevier inc., 2015.
About the author
 Himanshu Joshi retired from Shell in 2021 after 34 combined years with ExxonMobil and Shell, during which he specialized in heat exchangers and fouling. He was part of a team that was granted a patent related to fouling deposit analysis at ExxonMobil, and led applied fouling R&D projects at both companies. He has made several presentations about the field aspects of fouling and fouling mitigation, and deployed many mitigation technologies in the field. He can be reached by email at alph.hmj@gmail.com.