
Heat exchanger monitoring
In this series of articles we will look at how heat exchangers foul, how to understand the root causes of fouling, and how to mitigate the impact of fouling. The material presented is based entirely on the author’s experience and analysis of operating situations in the Oil & Gas industry. However, many theories and varied experiences exist across the industry and amongst researchers.
By Himanshu Joshi, Heat Exchanger Specialist

Monitoring heat exchanger performance is a very common practice, especially when fouling is a concern. It can be done very simply using a single calculation in a spreadsheet, or one can use software tools which can handle heat exchanger networks, work on large amounts of historical data, simulate different types of heat exchangers, model the fouling process for future predictions, and perform these tasks automatically on a time frequency of choice (such as daily). Intermediate approaches using a combination of software and manual calculations and approximations can also be used. Regardless of the sophistication of the calculation, the one requirement of monitoring should be that it can quantify the impact (or the loss) due to fouling, which should be done using the heat duty. Quantification of the loss (heat duty converted to money) should be used to make decisions – what actions to take and the cost vs benefit implications of those actions.
This article is a basic introduction to monitoring and its requirements. It is written with the assumption that the purpose of monitoring is to make decisions for taking actions and base those decisions on quantification using data, and not simply to know that performance is decreasing.
Data requirements and definitions
- Availability: Calculation of heat duty (Q) requires values of flow rates, inlet/outlet temperatures, and the specific heats or enthalpies corresponding to those temperatures. If data is available on at least one side (hot or cold), the operating heat duty can be calculated. Accuracy: Flow and temperature instruments need to be functional so the heat duty can be calculated with decent accuracy, say within ±15%.
- Heat Balance: It is desirable that the heat duties on the two sides (hot and cold) match, at least within a practical range of ±15%. Larger discrepancies will introduce errors depending on which side you choose to treat as correct.
- Frequency: Daily average readings of flows and temperatures are sufficient to provide good quantification and basis for actions. Only in rare cases would a higher frequency, such as hourly, might be required.
- Actual Heat Duty (Qa): Calculated daily, the operating heat duty using the current fl ow rates and temperatures. This value will inherently fluctuate, and the fluctuations could be large if the process flows and temperatures tend to have large swings.
- Clean Heat Duty (Qc): The heat duty with zero fouling using the same flows and temperatures that were used to calculate Qa. This calculation requires a simulation so cannot be done accurately if monitoring is done using simple formulas in a spreadsheet.
- Losses due to fouling: In terms of heat duty the loss is (Qc-Qa). This loss can be converted to economic losses depending on the role of the heat exchanger. If it impacts energy (say furnace fuel consumption) the cost of fuel and related emissions increases. If it leads to process rate cuts, the cost is in lost production and associated profits.
Simple monitoring
If at least one of the fluids is single-phase (liquid or gas) and the flow rate and the inlet and outlet temperature data is available, the heat duty (Qa) can be calculated daily and trended. The clean heat duty (Qc) can be approximated as the heat duty right after cleaning on the first day that full operating conditions were achieved. Sometimes operating engineers make a further calculation from the heat duty and temperatures – the overall heat transfer coefficient (OHTC) also known as the U-value. It is usually “normalized” to fixed flow values, and then trended.
It should be recognized that this approach doesn’t provide any quantification of the losses due to fouling, it simply shows that the heat transfer is decreasing and as such is not useful, unless one takes the further step of calculating Qc. If data from the single-phase side is not available, or if both sides involve a phase change (condensing and boiling), it is difficult to calculate a heat duty without some form of simulation of the fluid properties using the operating pressures and temperatures. For these cases computer tools become necessary.
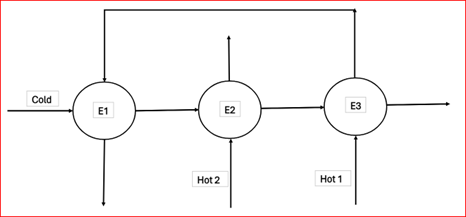
Network effects
Heat exchangers can be part of a heat integrated network of several exchangers where the performance of one heat exchanger affects the flow and temperature conditions of the other heat exchangers. A simple example is shown in Fig. 1. If the heat exchanger E3 fouls, or is removed for cleaning, the temperature of the Hot1 stream going to heat exchanger E1 changes, which also affects both the hot and cold temperatures in heat exchanger E2. Rather than the Qa and Qc values for the individual heat exchangers the values for all three heat exchangers together (called the network heat duty) should be used to make decisions.
Common problems
Here are some of the common problems encountered in doing accurate monitoring and in implementing the suggested actions. The most typical action is to clean the heat exchanger, where the method of cleaning and the expected benefit can be important (see Part 6).
- Incomplete or unreliable data. This results in loss of accuracy in the heat duty calculation and may affect the heat balance, which introduces further uncertainty as to which values to use. For critical heat exchangers, the solution is to provide or fix the necessary instrumentation.
- Two-phase heat exchangers. It is nearly impossible to perform accurate monitoring on services like condensers and reboilers without the use of computer tools. The calculations for both Qa and Qc require two-phase properties like vapor fraction, and a good computer program to perform two-phase calculations.
- Optimum Cleaning. Even with accurate monitoring it is not always possible to clean at the optimum time, which is when the sum of the costs of fouling and cleaning is the lowest. For example, the process interruption when the heat exchanger is out of service might be unacceptable. Practical approaches used by operators include planning in advance which requires the monitoring calculations to predict which would be the best heat exchangers to clean at a given future date. An alternative is to clean at fixed times during the year by using the monitoring program to identify the heat exchangers which would give the maximum benefit at that instant in time.
- Network Effects. To get accurate results for monitoring a network, even with very few heat exchangers, it is necessary to use a computer tool which can simulate the heat exchangers and the interactions in the network. If done manually, one must guess the impact a heat exchanger cleaning will have on the heat duty of the network.
- Duty Controlled Heat Exchangers. Some heat exchangers operate on a controlled fixed heat duty, such as on pumparound or reflux streams. Monitoring may show fouling but there may be no benefit to cleaning them until a point is reached where the process is affected. It is important to account for this in network calculations.
Summary
The best approach for monitoring heat exchangers for fouling is to quantify the losses and benefits of taking auctions such as cleaning. Comparing the operating heat duty to what would be the heat duty for a clean heat exchanger under the same operating conditions allows this quantification to be done. Although it is possible to use simple manual methods for single-phase services, networks and two-phase heat exchangers require process and heat exchanger simulation tools for accurate quantification.
Upcoming in Part 8
In the next article we will take a detailed look at the economics of fouling including how to evaluate mitigation methods for the best return.
Catch up on Fouling Focus!
Have you missed the earlier installments of this multi-part series? All articles are available in our online archive:
Part 1 – https://heat-exchanger-world.com/heat-exchanger-fouling-in-practice-understand-mitigate-1/
Part 2 – https://heat-exchanger-world.com/heat-exchanger-fouling-in-practice-understand-and-mitigate-part-2/
Part 3 – https://heat-exchanger-world.com/heat-exchanger-fouling-in-practice-understand-and-mitigate-part-3/
Part 4 – https://heat-exchanger-world.com/heat-exchanger-fouling-in-practice-understand-and-mitigate-part-4/
Part 5 – https://heat-exchanger-world.com/heat-exchanger-fouling-in-practice-understand-mitigate-part-5/
Part 6 – https://heat-exchanger-world.com/heat-exchanger-fouling-in-practice-understand-mitigate-part-6/
About the authors

Himanshu Joshi retired from Shell in 2021 after 34 combined years with ExxonMobil and Shell, during which he specialized in heat exchangers and fouling. He was part of a team that was granted a patent related to fouling deposit analysis at ExxonMobil, and led applied fouling R&D projects at both companies. He has made several presentations about the field aspects of fouling and fouling mitigation, and deployed many mitigation technologies in the field. He can be reached by email at alph.hmj@gmail.com.
About this Technical Story
This Technical Story was first published in Heat Exchanger World Magazine in April 2024. To read more Technical Stories and many other articles, subscribe to our print magazine.
Technical Stories are regularly shared with our Heat Exchanger World community. Join us and share your own Technical Story on Heat Exchanger World online and in print.